Our AI visibility
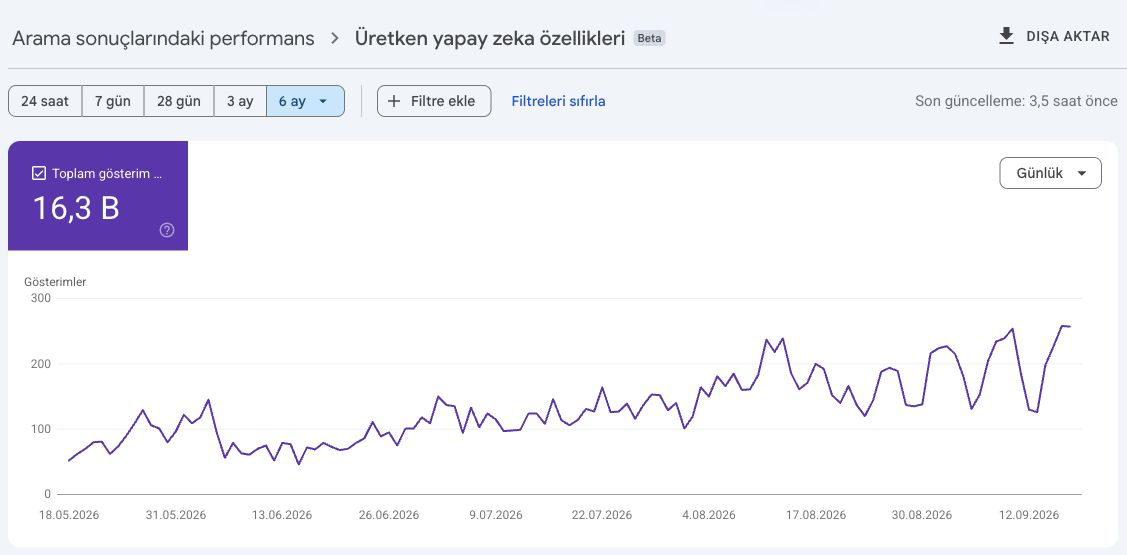
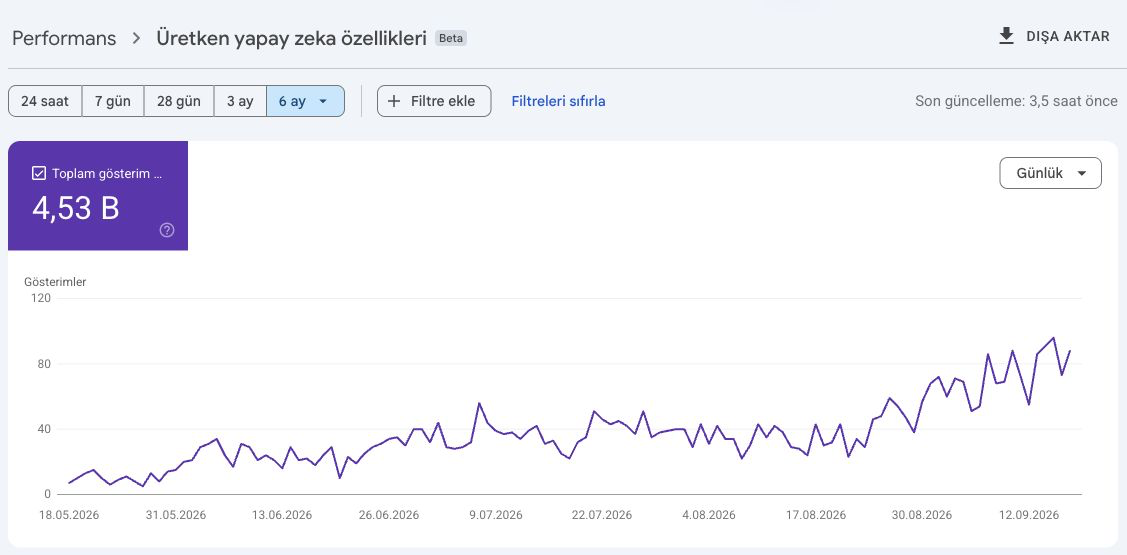
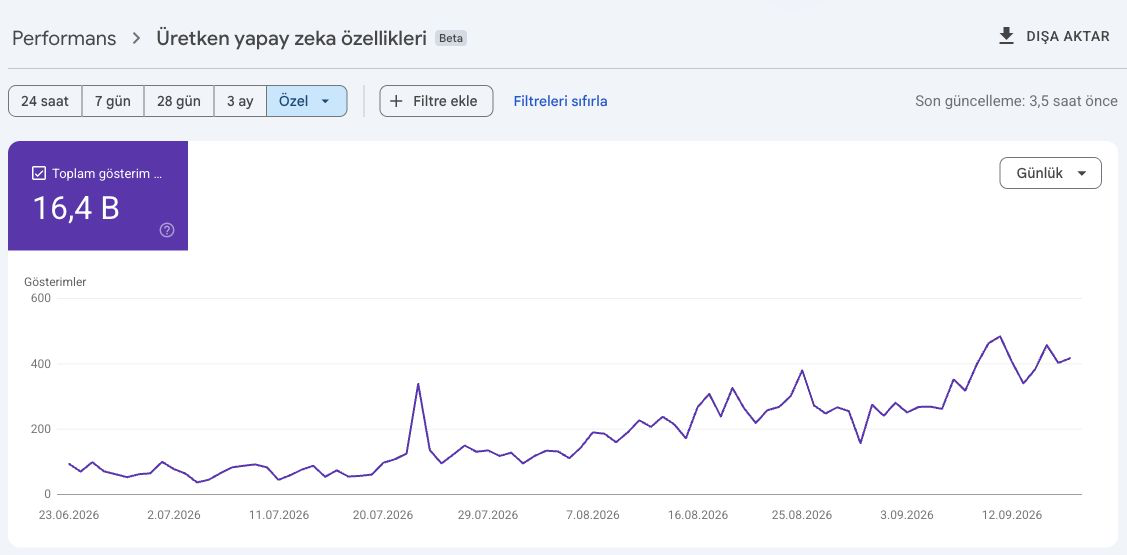
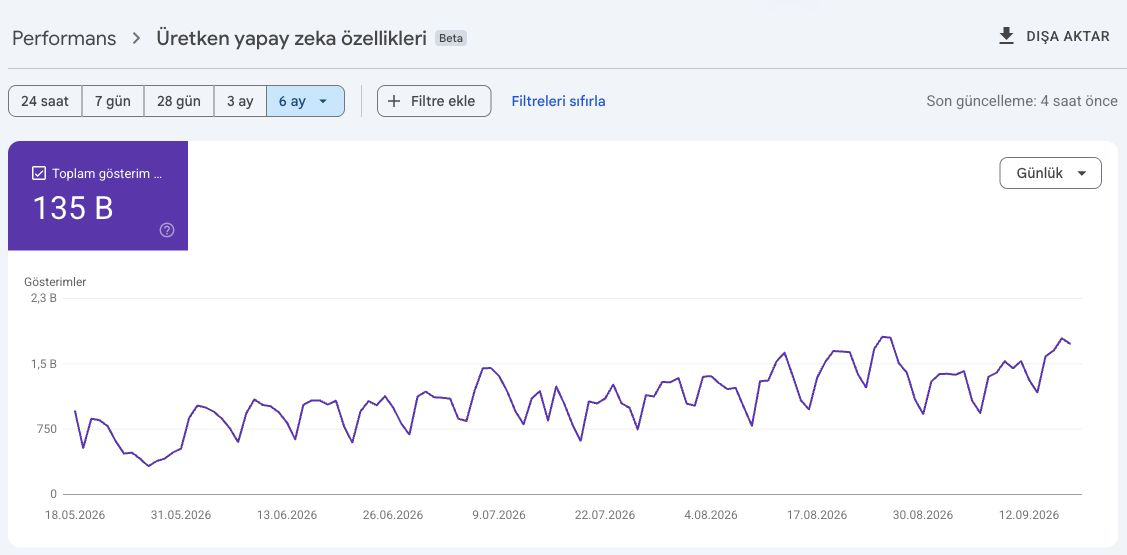
AI impressions rise steadily throughout the period.
Source: Google Search Console · Account and property details are hidden.
Since 2014, we have taken more than 3,600 brands across 40+ industries to the top of Google and AI answers. Here are some of our references and the concrete results we achieved for them.
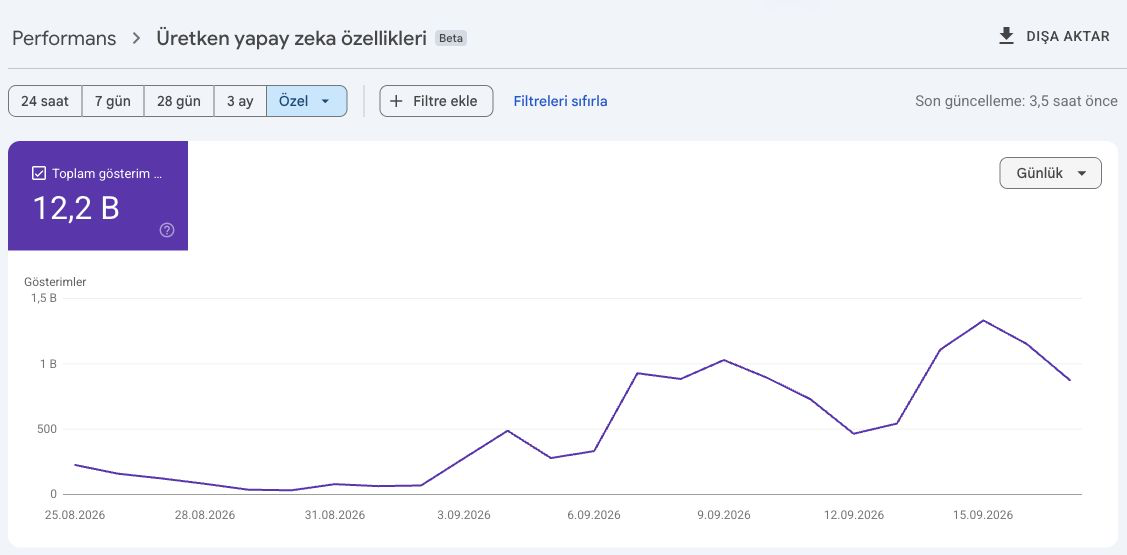
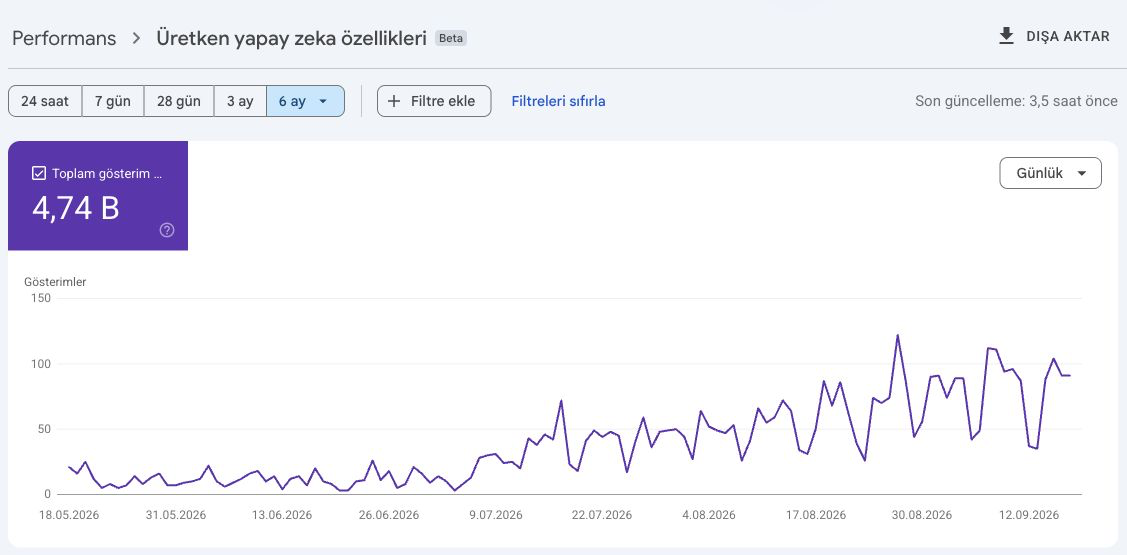
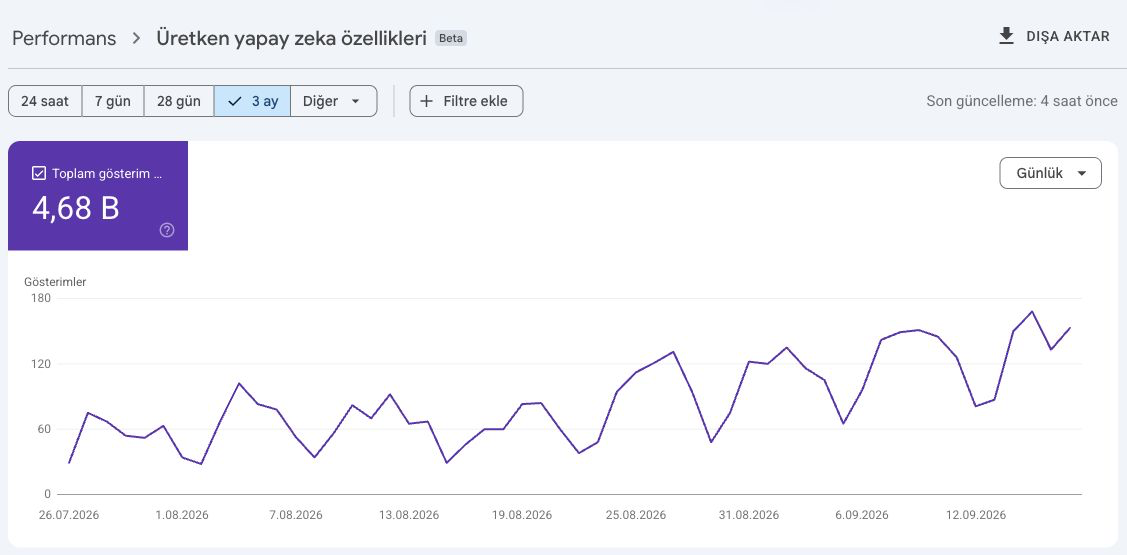
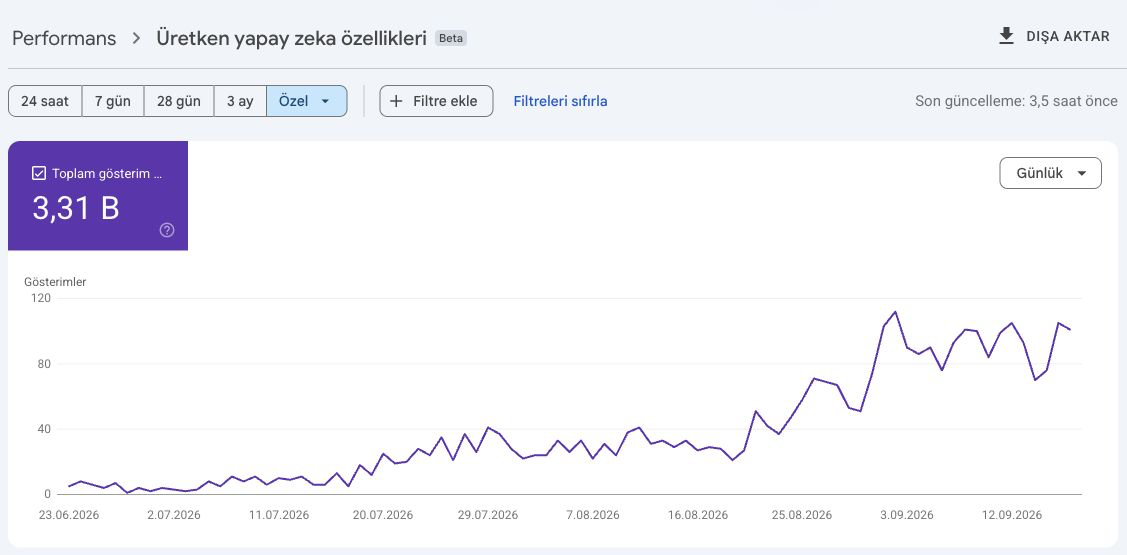
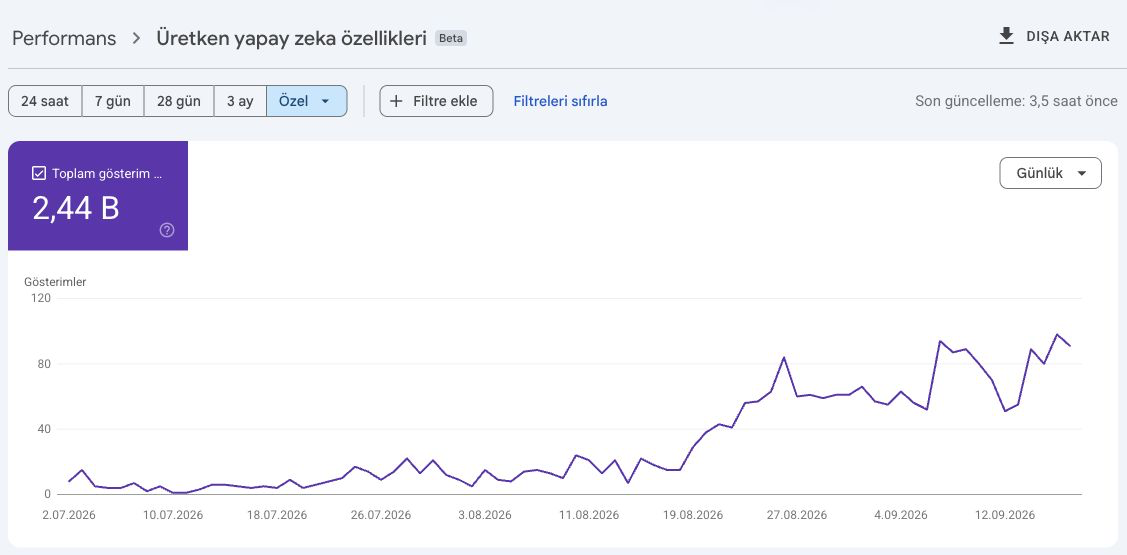
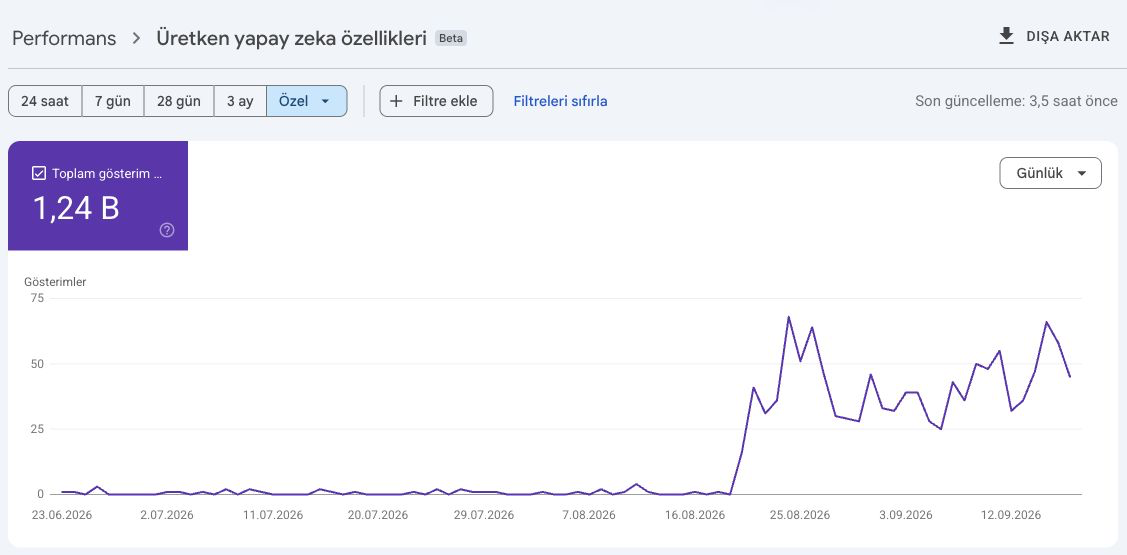
Seobaz's own results, plus the generative AI visibility in Google Search of 10 clients across different industries.
AI impressions rise steadily throughout the period.
Source: Google Search Console · Account and property details are hidden.
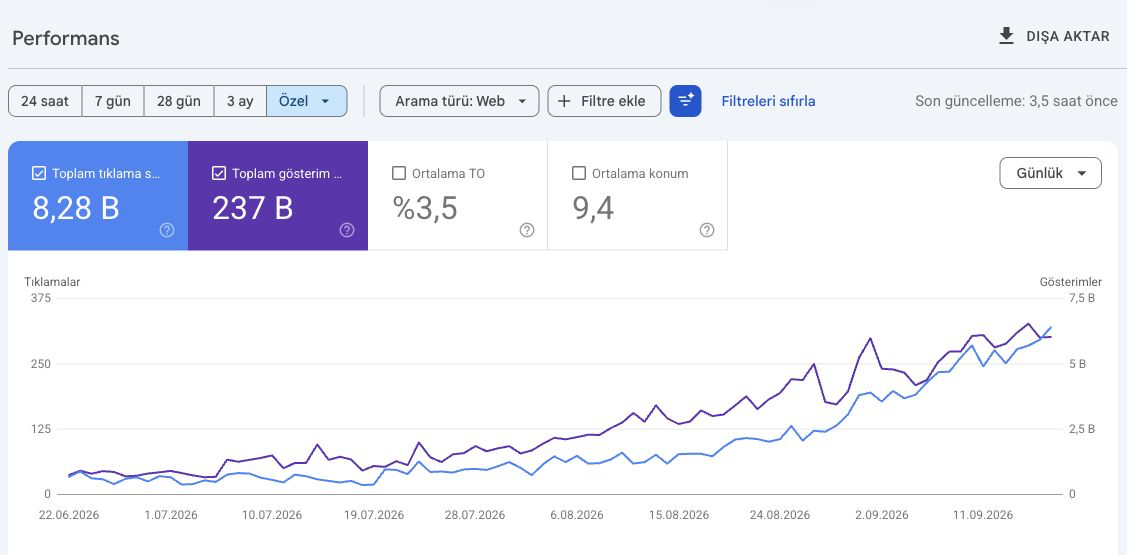
Organic click and impression curves rise together.
Source: Google Search Console · Account and property details are hidden.
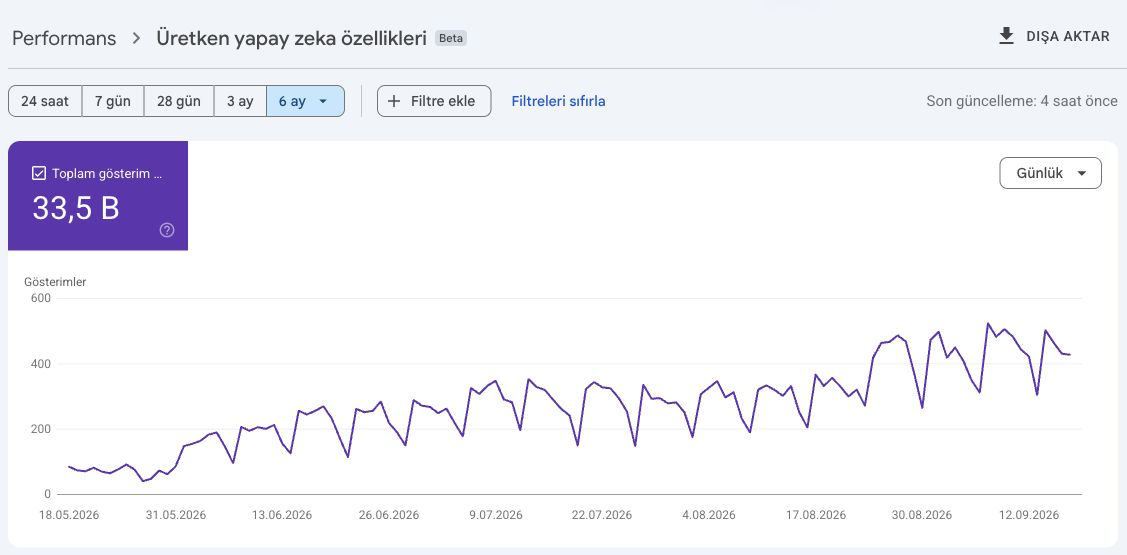
Visibility started high and climbs further in September.
Source: Google Search Console · Redacted for brand confidentiality.
Daily volume grew from May to September and holds at the end of the period.
Source: Google Search Console · Redacted for brand confidentiality.
Despite daily fluctuations, the overall trend is upward.
Source: Google Search Console · Redacted for brand confidentiality.
A clear increase in a short time, from late August into September.
Source: Google Search Console · Redacted for brand confidentiality.
The rise that started in July reaches a higher volume in September.
Source: Google Search Console · Redacted for brand confidentiality.
Visibility that began in late July strengthens in September.
Source: Google Search Console · Redacted for brand confidentiality.
A rise in late August after a long flat period.
Source: Google Search Console · Redacted for brand confidentiality.
A gradual, steady rise from a low level in June.
Source: Google Search Console · Redacted for brand confidentiality.
The increase that began in the second half of August continues into September.
Source: Google Search Console · Redacted for brand confidentiality.
From a near-zero line to lasting visibility in late August.
Source: Google Search Console · Redacted for brand confidentiality.
The generative AI report is a new area; on most sites this chart is a flat line at zero. Daily values are approximate readings from the charts. Periods are shown on each card, and totals may not cover the same time span.
The figures below are not presentation polish: they come from Google Search Console and daily rank tracking. All four cases were measured within the last two months, in July-August 2026. These are not old projects picked from the archive.
A few of the organic traffic transformations our SEO clients have seen since they started working with us. We repeat that success in every industry, figure after figure.
Healthcare
E-Commerce
Telecommunications
Tourism
Automotive
Home Appliances
Game Codes
Machinery Manufacturing
Data Center
Social Media
Petroleum
Automotive
Insurance
Education
Jewelry
Textiles
Media
Healthcare
Healthcare
Laboratory
Textiles
Furniture
Call Center
Game Codes
Sporting Goods
Game Codes
Water Treatment
Let the next growth figure come from your site. First, let's measure where you stand today.
Request a free analysisWe'll analyze your site on 4 AI engines and Google, then share a tailored SEO + GEO roadmap within 24 hours.
Hi 👋 Send us your website address and we'll take a quick look and send you a tailored SEO quote the same day.
Get a Quote