Measurement actually answers three separate questions
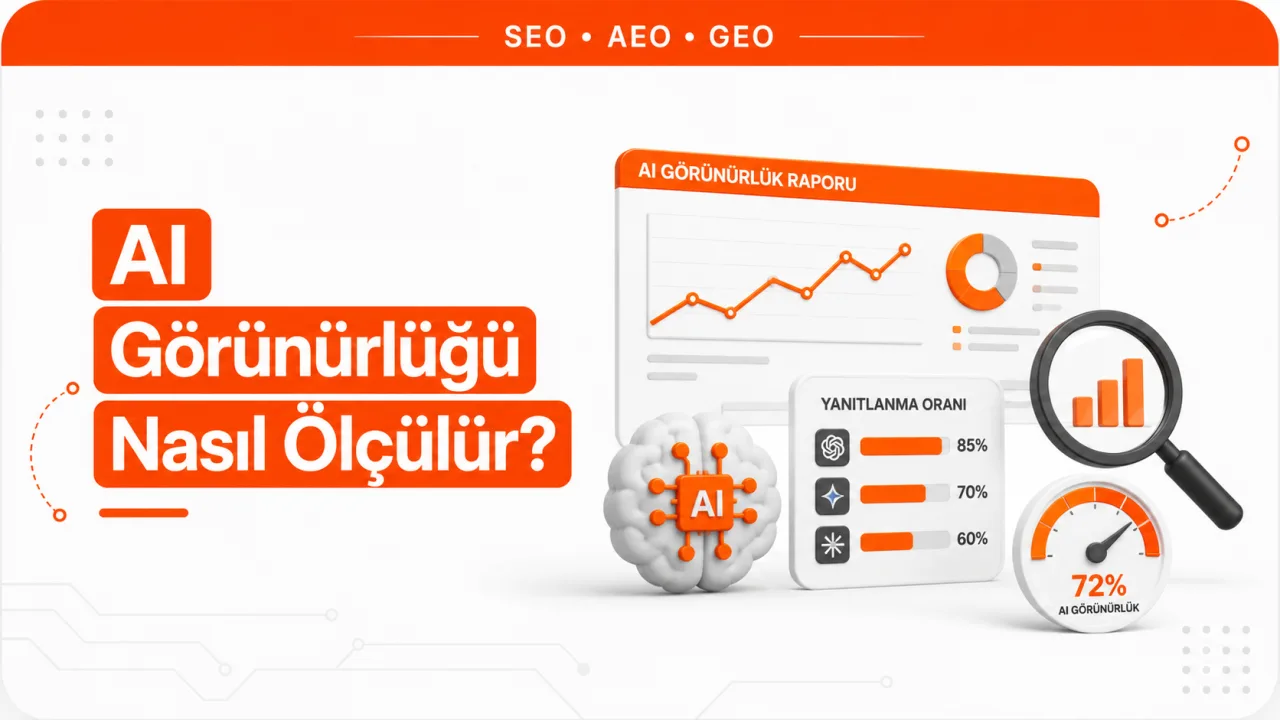
AI visibility cannot be measured with a single number. The score that dashboards display combines the answers to three independent questions into one indicator: which questions were asked, what appeared in the answer, and how much space competitors took up in that same answer. These three questions are measured with different methods and break down in different ways. Before reading the score, you need to know which question's answer you are looking at.
Prompt monitoring
Prompt monitoring is a form of measurement that runs a predefined set of questions at set intervals on surfaces such as ChatGPT, Gemini, Perplexity, Google AI Overviews and AI Mode, and records the answers that come back. What it measures is clear: what happens for the questions in that set. What it does not measure is just as clear. It does not show which questions real users ask, or how often. A prompt set is not data; it is your assumption about demand. If the set is built wrong, the measurement can run flawlessly and still measure the wrong universe.
Share of voice
Share of voice is a relative metric that divides the number of answers mentioning your brand by the total visibility produced for you and your defined competitors. It shows your position within the category. It does not show market share, demand volume or purchase intent. The critical detail is this: the denominator is the competitor list you chose. Adding a brand to the list mathematically lowers everyone's share. When the competitor list changes, the score changes too, but that change has nothing to do with your brand's performance.
Visibility score
Visibility score is a derived indicator that weights the mention rate with signals such as position, order, context and sometimes sentiment analysis, and reduces it to a single number. What it really measures is the provider's weighting choices. It is not a standard quantity. A 62 on one platform and a 62 on another do not describe the same reality, and the two numbers cannot be used interchangeably.
| Metric | What it measures | What it does not measure | What distorts the result most |
|---|---|---|---|
| Prompt monitoring | What appears in answers for a defined question set | The real distribution of questions and search volume | How representative the prompt set is, and the number of runs |
| Share of voice | Visibility share relative to a defined competitor set | Market share and size of demand | Changes to the competitor list |
| Visibility score | A combined signal weighted by the provider | A level comparable across providers | Updates to the weighting formula and methodology |
Citations and brand mentions are separate metrics
Four distinct events take place while an answer is being generated. Your page enters the pool of candidate sources, it gets cited as a source, your brand name appears in the text of the answer, and the information on your page actually makes it into the answer. All four can happen at once, or any one can happen alone. Your page may appear in the source list while your brand name never appears in the answer. Or the model may recommend your brand by name without linking to any of your pages.
There is concrete evidence for this distinction. Ahrefs' analysis of 540,000 query pairs found that no brand or entity name appears in 59.41% of AI Overview answers, while in AI Mode the figure is 34.66%. In the same analysis, 11% of AI Overview answers show no sources at all, a figure that drops to 3% in AI Mode. In other words, the vast majority of answers have sources but no brand name. If citations and brand mentions are logged in a single visibility column, this pattern disappears from view.
The two metrics also have different origins. Citations mostly come from your own pages and relate to technical accessibility and passage quality. Brand mentions, on the other hand, are often fed by third-party surfaces. The model picks up your name from a listicle, a news article or an industry page. That is why external authority surfaces, such as publication and link-building work that gets your name onto news and industry sites, affect the brand mention metric independently of the citation metric. Our article on answer engine optimization, which looks more closely at how answer engines choose sources, shows how these two surfaces diverge.
Why does the same prompt produce different answers?
Variability has two independent sources, and they should not be confused.
The first is the model layer. In an experiment published by Thinking Machines Lab, running the same prompt a thousand times at temperature zero produced 80 different completions. The first 102 tokens were identical across all runs; divergence began after that. The study's main finding concerns the cause. The common explanation, floating-point arithmetic, is not enough on its own; the real source of the problem is that the kernels lack batch invariance. As server load changes, the number of requests processed at the same time changes, and the numerical result shifts with it. When the team repeated the test with batch-invariant kernels, all thousand runs produced the same output. The practical meaning: your answer can change depending on how many other people are asking questions on the server at that moment.
The second is the retrieval layer. A search runs before the answer is generated. Google's own documentation states plainly that AI Mode uses query fan-out: the model generates concurrent, related queries and pulls in additional results. These sub-queries do not have to be identical on every run, so the pool of candidate pages is not fixed either.
Here is how the two layers combine in measurement. In Ahrefs' analysis comparing AI Overviews and AI Mode answers for the same queries, the URLs cited by the two surfaces overlap only 13.7% of the time, while 89.7% of answer pairs stay above the 0.8 threshold on a semantic similarity measure. The substance of the answer stays stable; the source list does not. The same study also notes that 45% of AI Overview citations change from one generation to the next.
The picture is similar at the brand level. In SparkToro's dataset of roughly three thousand runs collected through a volunteer panel in a consumer product category, the probability of the same brand list repeating in any two answers stayed below one percent. The probability of the same list repeating in the same order was around one in a thousand. Because this study covered a single category and relied on volunteers' manual records, the numbers may vary by sector, but the direction is clear: a ranking-based reading is not meaningful in this environment.
A single run is not a measurement
Mention rate is a proportion, and every proportion has a margin of uncertainty. That margin narrows as the number of runs grows. For a brand with a true mention rate of 30%, the approximate width of the 95% confidence interval by number of runs is as follows:
- 10 runs: approximately ±28 points
- 25 runs: approximately ±18 points
- 50 runs: approximately ±13 points
- 100 runs: approximately ±9 points
- 250 runs: approximately ±6 points
- 500 runs: approximately ±4 points
- 1,000 runs: approximately ±3 points
Here is how to read this list. A dashboard that reports a 25% mention rate from 20 runs is really saying the true rate is somewhere between roughly 5% and 45%. With an interval like that, you cannot say "we improved over last month."
Comparing competitors is even harder, because two uncertainties stack on top of each other. For two brands measured at 30% and 35%, each with 100 runs, the confidence interval of the difference is roughly ±13 points. So a 5-point gap sits inside the noise. Separating a difference of that size statistically requires around 700 runs per brand.
One caveat: this calculation assumes the runs are independent of each other. In reality they are not. Session memory, location, language, account history, caching and model version tie runs together. The real uncertainty is therefore higher than the figures above, and these numbers should be read as a lower bound.
Why do two dashboards give the same brand different scores?
Two tools measuring the same brand in the same week can produce very different results. The reasons are methodological, and most of them are not visible in the interface.
- Prompt set. This is the biggest source of difference. If two tools use different question sets, they are measuring different universes, and their scores cannot be compared under any circumstances.
- Number of runs and timing. A tool that measures once a day and one that measures ten times a day do not have the same noise level.
- Platform mix. Which engines are aggregated, and with what weight, shifts the score directly.
- Access method. Is the measurement done through the API or the product interface? API answers do not carry most of the personalization, memory and location signals.
- Metric definition. Some tools count the brand name appearing in the text, others count only linked citations. A metric with the same name can measure two different things.
- Weighting. Being mentioned at the start of an answer and at the end may not score the same, and that choice is specific to the provider.
- Language and country. Answer behavior for Turkish queries differs from English queries, and mixed measurement blurs the two together.
The rule that follows is simple. Don't compare scores from different tools. Compare a single tool's own time series, and only as long as its methodology stays fixed. When a provider expands its prompt set or updates its platform mix, the series breaks, and on the chart that break often looks like a normal fluctuation.
Data on your own server is the countable layer of measurement
Prompt monitoring looks from the outside and works with samples. Data on your own property, by contrast, is based on counting. The two are not alternatives; they complement each other.
Search Console's generative AI performance report collects your site's impressions in AI Overviews and AI Mode in a separate view. You need to know the limits of this view. The report is built on impression data, carries no ranking metric and does not explain how the page was used within the answer. Because the chart aggregates at the property level and the pages table at the page level, the chart total and the table total may not match. The report has not been rolled out to all properties, and the most recent end of the data may be incomplete. Google also states that generative AI surfaces rely on its core search systems and do not require a separate optimization discipline.
The second source is referral traffic. On the analytics side, sessions coming from AI interfaces can be tracked as a separate channel. This data only shows clicked citations. It does not show citations that were not clicked, or brand mentions that happen without any link, so it does not represent visibility as a whole.
The third source is server logs. OpenAI's publisher documentation treats these as two separate choices: allowing OAI-SearchBot so you can appear in search results, and blocking GPTBot to opt out of training. Separating these user agents in your logs shows why your page was fetched, and no dashboard shows you that. Our AI Overview research focused on the Turkish market, which examines at corpus level how source selection relates to page characteristics, shows with examples how this technical layer affects measurement.
Five decisions to make when setting up measurement
- The prompt set is frozen and versioned. The set is built from real customer questions, with branded and unbranded questions kept separate. When the set changes, a new version is opened and it is not compared with the old series.
- The number of runs is set in advance. The target is chosen based on the size of the change you want to track. If you are going to track a five-point difference, you need hundreds of runs, not dozens.
- Metrics are kept in separate columns. Citations, brand mentions and information carried into the answer are not rolled into a single score. All three rise for different reasons and are fixed through different interventions.
- Raw answers are archived. What gets stored is not the score but the answer text and the source list. When a provider updates its methodology, retroactive recalculation is only possible with raw data.
- The competitor set is locked. The brands that go into the share of voice calculation are defined from the start. If the list is later expanded, previous periods are recalculated with the same list.
Once these five decisions are made, measurement stops being a dashboard and becomes a comparable series. On the business side, designing this setup, building the prompt set and managing regular runs is the first step of AI visibility work, because you cannot read the results of improvements on a surface you cannot measure.
Frequently Asked Questions
How many prompts are enough to start measuring?
The right question is not the number of prompts but the number of runs per prompt. Running twenty prompts once a month produces less information than running five prompts ten times a week. Starting with a narrow set and many runs, then expanding the set over time, gives more reliable results than scanning a broad set with a single run.
If my mention rate dropped, is something wrong with my page?
Three things should be ruled out first. Is the drop within the confidence interval? Did the prompt set or competitor list change? Did the provider update its methodology? If there is still a drop after ruling out these three, and the drop shows up across more than one engine at the same time, it makes sense to look at the page side.
I get citations but no traffic. Has measurement failed?
No, it means measurement is separating two different events. A citation is visibility; a click is behavior. When the answer itself fully satisfies the user's question, the citation is not clicked. In that case, read visibility not through traffic but alongside secondary indicators such as brand mention rate and branded search volume.
Are free one-off visibility tests useful?
They are useful as a starting snapshot, not as measurement. A single run is the measurement with the widest confidence interval, and you cannot conclude that you are invisible just because your brand did not appear in that run. These tests only become a series when they are repeated regularly on a fixed set.