What Search Console and GEO tools measure
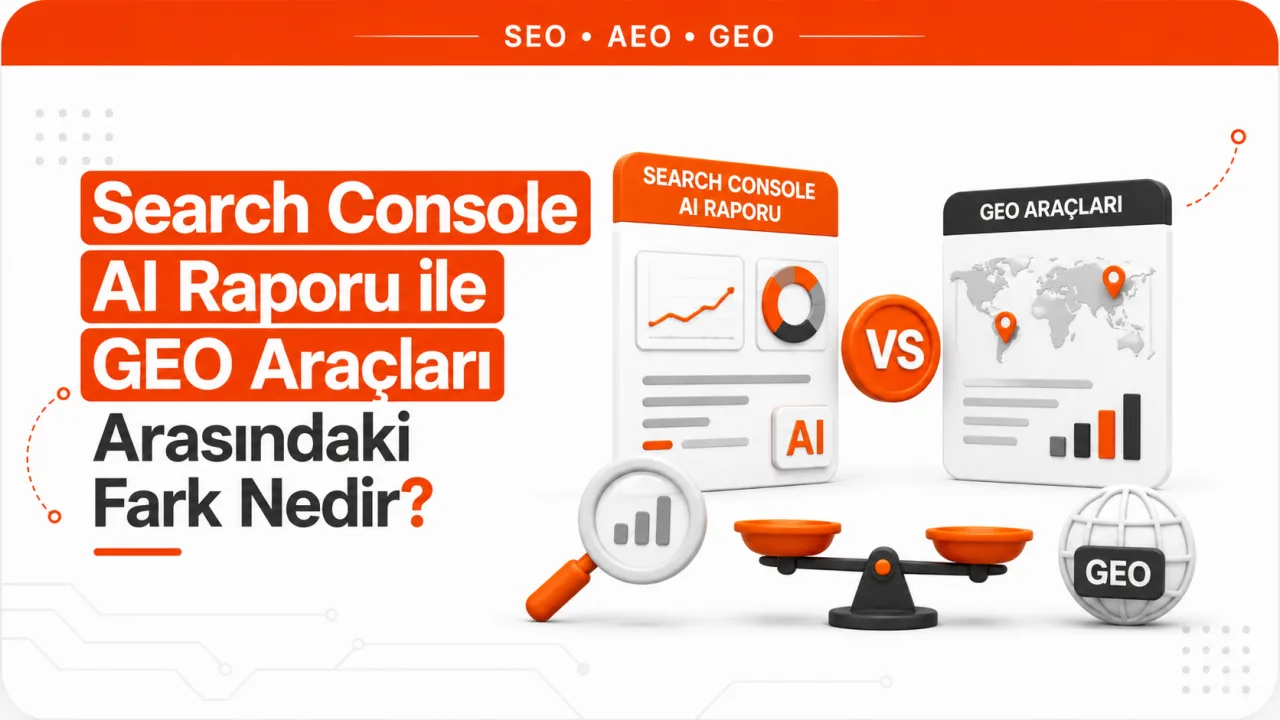
If two numbers for the same brand in the same week don't match, there is no need to look for a measurement error. Search Console reports to the site owner on events that take place inside Google's own infrastructure. GEO tools, on the other hand, run their own question lists across several AI engines and scan the answers that come back. One is an event log; the other is a sample. There is no structural reason for the two to give the same result.
In practice, the distinction looks like this. Search Console tells you, with hard evidence, whether your page was shown in a Google AI answer, but only for Google. GEO tools show which brands are mentioned for questions in your category across a broad surface including ChatGPT, Perplexity, Gemini and Copilot, but what they show is an estimate. The literature on generative engine optimization and answer engine optimization often uses these two sources in the same table, yet they produce different kinds of evidence.
What Search Console actually reports
The generative AI report contains impressions only
Google provides a separate generative AI performance report in Search Console for AI Overviews and AI Mode. This report's only metric is impressions. The data can be broken down by page, country, device and date. There is no query dimension. There are no clicks or click-through rate. When two results from the same site appear together in the same AI answer, this counts as a single impression, so two links in the block are not counted twice in the report.
The report's scope is also limited. Search Labs experiments are not included in the report because they are still in development. The report has not been rolled out to all properties at once, and sites below the minimum impression threshold see no data. AI features in Google Discover have their own separate report. Search Console's general limitations also apply: the 1,000-row table limit, the date range limit and anonymized queries that are left out of the table for privacy reasons.
AI clicks stay inside the web total
On the click side, things are more interesting. A click on an external link inside AI Overviews counts as a click. So does a click on an external link inside AI Mode. However, these clicks don't get a separate row; they are included in the web search type total in the main performance report. So the clicks exist, are counted and go into the total, but there is no way to separate out which surface they came from.
Position calculation also varies by surface. AI Overviews occupy a single position in search results, and all links inside the block get the same position. In AI Mode, position is calculated the same way as on a normal results page. When a user asks a follow-up question in AI Mode, it counts as starting a new query, and all the impression, position and click data in the new answer is recorded against that new query. This means interest accumulated over the course of a conversation is not attributed to a single query.
So here is where things stand: impressions exist in a separate report but without queries, and clicks exist in the total but without surfaces. Search Console does not give a complete answer on AI visibility; it gives two half answers. For the basic habit of reading what the metrics measure, the real definitions of the four metrics in the performance report are still the starting point.
How do GEO tools generate data?
A prompt set is an attempt to represent real demand
The measurement logic of third-party platforms is completely different. A vendor first builds a prompt pool, then runs these prompts on the engines, stores the answers that come back and searches them for the brand name and domain. Where the pool comes from varies from vendor to vendor, and that is where the difference begins.
In its Brand Radar methodology, Ahrefs explains that it derives prompts from Google's corpus of related questions and its own keyword database, splits them into sub-questions using two separate expansion systems and runs the queries on the engines' public interfaces. Semrush states that it maintains a database of hundreds of millions of prompts and answers, feeds this pool with AI search clickstream data and Google keyword data, removes duplicates and simplifies the wording. Both approaches are defensible. Expecting them to produce the same number for the same brand is not.
Refresh cadence differs too. Some chat engines are refreshed monthly and reported over a ninety-day window. The AI Overviews and AI Mode side is updated continuously. Prompt tracking defined by the user can run daily. Search Console goes down to hourly granularity. Even if you are looking at the same calendar week, the data the two systems load for that week may not come from the same time period.
The most useful caveat comes from the vendors' own methodology pages. Ahrefs describes its metrics as directional indicators rather than exact traffic counts and uses the phrase "modeled visibility signal." The same document openly acknowledges that there is no verified link between Google search volume and how often a question is asked inside an AI tool. The same page also states that hallucinated links are not filtered out and that the language with the strongest coverage is English. This is not a weakness of the tool; it is the nature of sample-based measurement.
Mentions and citations are separate metrics
The most common mistake when mixing up the two sources is to treat a brand mention and a source citation as a single metric. The brand name appearing in the answer text is a mention. The site being linked as a source is a citation. An answer may mention the brand three times and give no link at all. Another answer may cite the site as a source and never write the brand name.
By design, Search Console can only see the second case, because what it measures is a URL being shown. When your brand name appears in an AI answer without a link, it leaves no trace in Search Console. GEO tools' visibility scores, meanwhile, often blend mentions, citations and position within the answer into a single number. The formula's weights are vendor-specific and cannot be audited from the outside. This is the most common reason two different tools give the same brand different scores.
The two systems side by side
| Criterion | Search Console AI report | GEO measurement platforms |
|---|---|---|
| Data source | Google's own logs, events that actually occurred | Prompt runs executed by the vendor, a sample |
| Surface covered | Google only, AI Overviews and AI Mode | Multi-engine, chat engines and Google surfaces |
| Main metric | Impressions | Mentions, citations, visibility score, share of voice |
| Query and prompt visibility | None | Yes, but the vendor's own list |
| Click data | Yes, but buried in the web total | None |
| Competitor data | None | Yes |
| Brand mentions | Not visible | Measured |
| Nature of the data | Count | Estimation and modeling |
| Access requirement | Free, verified ownership required | Paid, no ownership required |
Why don't the numbers match?
The conflict between the two sources is not a malfunction; it is the sum of six separate structural causes.
- Different universes. Search Console counts real events belonging to your site. The tool counts the results of a question list it chose itself. If the list does not represent the real distribution of demand in your category, neither does the result.
- Different units. On one side there are impressions; on the other, a mix of mentions and citations. Ratios built on different units won't match in the first place.
- Stochasticity. The same prompt run again on the same engine can produce a different answer. Academic measurement studies show that visibility measurements based on a single run are unstable and require repeated sampling.
- Personalization. Tools usually collect answers in a logged-out environment with no history. Real users ask while logged in, with a known location and in a context where previous conversations are remembered.
- Time window. A data pool refreshed monthly and a report updated hourly fill the same calendar range differently.
- Thresholds and deduplication. On the Search Console side, the 1,000-row limit, anonymized queries, the minimum impression threshold and the rule that counts two results from the same site as one impression all apply. The tool side may have no such deduplication.
Which question should you ask which source?
The simplest way to decide is to match each question to a source.
- Are my pages actually shown in Google's AI answers? The Search Console generative AI report.
- Which of my URLs appear on these surfaces? Search Console, page dimension.
- Am I getting clicks from AI surfaces? The Search Console web total, without a surface breakdown, together with site analytics.
- Which brands do ChatGPT or Perplexity recommend in my category? A GEO tool.
- Is my competitor mentioned more often than me? A GEO tool, share of voice report.
- Which sources do AI answers cite? A GEO tool, citation source analysis.
- In what context and with what tone is my brand described? A GEO tool, brand perception report.
- What do visitors coming from engines other than Google do? Site analytics, referral source breakdown.
How to read the two together
For teams that want to bring the two sources together on a single dashboard, the approach that works is not adding up the numbers but separating the roles.
- Treat Search Console as ground truth. The impression curve on Google's surface is the only verifiable foundation.
- Use the GEO tool as a discovery layer. That is where you see which questions never reach you and which sources are cited instead of you.
- Never compare the absolute numbers of the two systems. Read only the trend within each one.
- Feed the tool's prompt set from your own real query data. If you track real phrases from the Search Console query table as prompts, the sample gets closer to real demand.
- Map the page overlap. Compare the list of URLs receiving AI impressions in Search Console with the list of URLs the tool reports as cited. The overlap shows your strong pages, while the differences point to a weak spot in either the tool's sample or your content structure.
- Don't make decisions based on a single run. To see the effect of a change, measure the same prompt again at different times.
This framework is not a product recommendation. A team with no measurement budget can also build a meaningful foundation with Search Console and repeated manual query tests. For a brand competing with many rivals on the same questions in its category, however, third-party sampling covers the area Search Console cannot see at all. The right question is not which tool to buy but which decision requires which type of evidence. For teams that want to move forward with AI visibility measurement, getting this distinction clear first matters more than choosing a tool.
Frequently Asked Questions
Why don't clicks appear in the Search Console AI report?
The generative AI performance report provides only the impressions metric. The click data is not lost; it is counted within the web search type total in the main performance report. Google does not publish these clicks as a separate breakdown by AI surface, so isolating clicks that come from AI is not currently possible.
Can Search Console impressions rise while a GEO tool's score falls?
Yes, and this is not a contradiction. The tool usually measures brand mentions across a multi-engine prompt set. Search Console counts URL impressions only on Google's surface. If your visibility on Google is growing while your mentions in chat engines are declining, the two curves move in opposite directions. Both numbers can be correct.
Which source is more accurate?
Accuracy depends on the question. Within the narrow area it measures, Search Console data counts events that actually happened and contains no estimation. However, it says nothing about engines other than Google and cannot see brand mentions at all. GEO tools fill that gap, but their data involves sampling and modeling. The broader the scope, the lower the precision.
Can AI visibility be measured without a GEO tool?
Partly. The Search Console generative AI report gives you the impression curve for Google's surface. On top of that, you can take a fixed list of questions that represents your category, run it manually on different engines at regular intervals and record the results. This method is slow and its competitor coverage is narrow, but when done repeatedly it produces a directional signal.