The Only Number the Report Gives Is Impressions
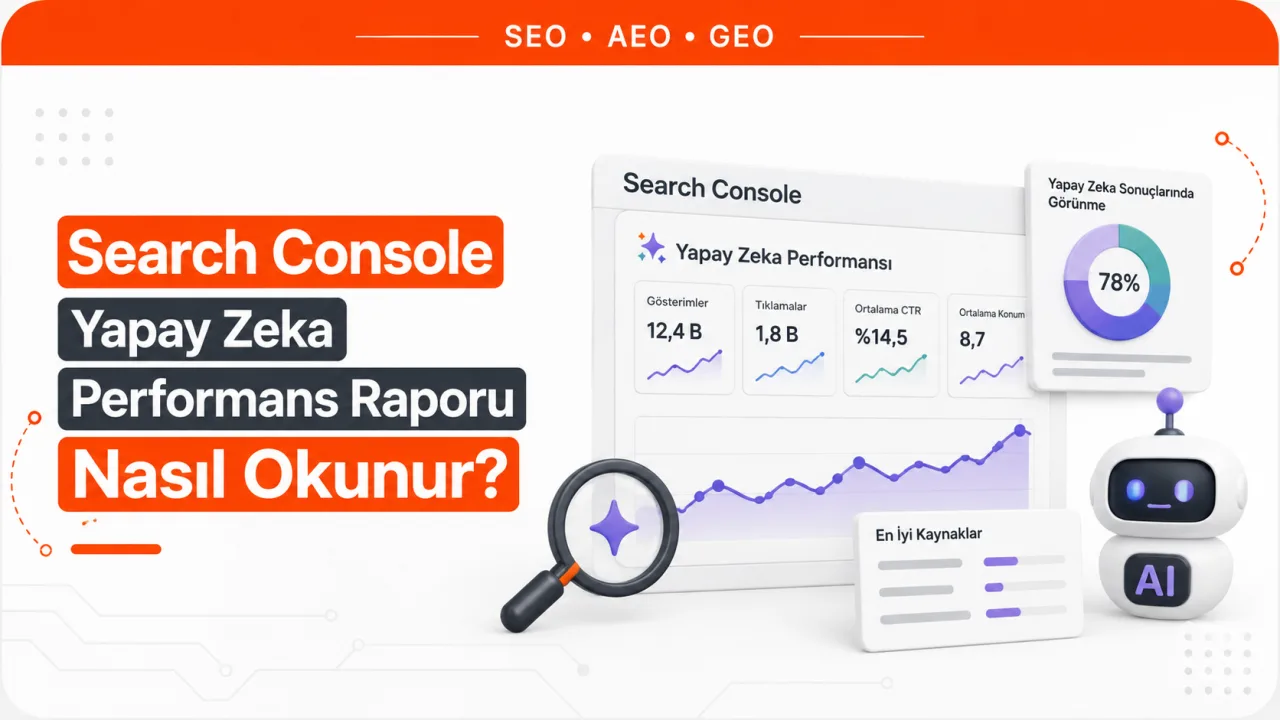
Google Search Console has a separate performance report for AI surfaces. The report tells you how many times your site's links were shown inside AI Overviews and AI Mode. What it doesn't tell you is how many of those impressions turned into clicks. There are no clicks, no click-through rate, no average position and no query breakdown on the screen.
That's why the question of whether AI answers bring traffic splits in two. The first half can be measured: does your site appear among the sources of these answers, with which pages and how often? The second half can't be measured today: how many visitors this visibility brings. Clicks on links in AI answers are counted by Search Console and sit inside your total click figure, but they aren't shown as a separate line.
Which Surfaces Does the Report Cover?
The scope is limited to two surfaces: AI Overviews and AI Mode. Google notes that this list may be updated over time. Search Labs experiments aren't included in the report, because they are still in development. AI features in Discover are getting a separate report.
The report sits under its own heading among Search Console's performance reports. Impression data can be grouped by four dimensions: page, country, device and date. The page breakdown is based on the final URL after redirects and the canonical URL, meaning the address in the list is the address the AI answer links to.
The report was first made available to a limited group of properties and then rolled out to all properties worldwide. So an empty screen doesn't necessarily mean an access problem; it's also possible the site simply hasn't received impressions on these surfaces yet. The reading habits you use in the main performance report apply here too; the basic approach to tracking Search Console data doesn't change for this screen.
How Are Impressions Counted on These Surfaces?
An impression means a link to your site was shown to a user inside an AI feature. Search Console's standard impression rules apply to the count.
The standard rule works like this. If a result is on the currently open results page, it counts as an impression even if the user doesn't scroll down to see it. The exception is scrolling and expandable components. For an item inside a carousel or a block that expands on click to count as an impression, it has to become visible within that component. Because a significant share of source links in AI answers sit in this type of block, the distinction has practical consequences. Even if the answer itself appears on screen, an impression may not be recorded if the link block wasn't expanded.
The two surfaces behave differently when it comes to position. An AI Overview occupies a single position in the search results, and all the links inside it get that same position. In AI Mode, position is calculated the same way as on a regular search results page.
There's another behavior specific to AI Mode. When a user asks a follow-up question below the answer, it counts as a new query, and all the impression, position and click data in the new answer is attributed to that new query. A single user session can thus produce several queries and several impressions. So a rapid rise in the impression figure doesn't, on its own, mean you're reaching more people.
AI Data Isn't Separate From Classic Search Data
This is the most frequently misread aspect of the report. Google says the AI performance report contains data that belongs to the Web search type in the main performance report. The impressions here aren't a new pool added on top of the total but a slice carved out of it.
The practical consequence is clear: adding the two numbers together is wrong; taking the ratio is right. The meaningful derived metric is the share of AI impressions within total Web impressions. That share is a visibility indicator, not a traffic indicator.
The separation exists only for impressions. Click, query and position data sit mixed together in the main report, and there's no separate filter for these surfaces in the main report. This creates a reading trap. The position shown in the report is the topmost position your page received for a query. Because an AI Overview occupies a single position and gives that position to all the links in it, a page sitting low in the classic list can appear to have an improved average position simply because it's a source in the AI Overview. Movement in average position shouldn't automatically be read as ranking movement.
Today's Answer to the Click Question
A click on an external link in an AI answer is counted as a click in Search Console. This applies to both AI Overviews and AI Mode. So if these surfaces bring traffic, it's already reflected in your total click figure.
What's missing is the breakdown. The AI report has no clicks column, and the main report has no breakdown that flags these clicks. Google says it will add more metrics over time, but as things stand, the question of how many clicks come from AI answers has no answer inside Search Console.
The analytics side doesn't close this gap either. Visits from AI surfaces reach the site as Google organic traffic and carry no marker that would distinguish them from a classic blue-link click. Setups that try to isolate the surface by looking at the referrer therefore don't produce reliable results.
The method left is cross-reading. Tracking the AI impression share and total clicks side by side for the same period shows whether there's a relationship. It's a relationship, not proof. Ranking changes, seasonality, changes in the results page layout and content updates can all pull the same chart in the same direction. Build your measurement setup around this limitation; in AI visibility tracking as well, the questions a single dashboard can't answer only get resolved by reading multiple sources together.
Conclusions You Can Draw From the Report
| What this data can tell you | What this data can't tell you |
|---|---|
| Whether the site is used as a source in AI answers | How many visitors came from an AI answer |
| Which pages stand out on these surfaces | Which question produced that impression |
| The country and device distribution of impressions | The split between AI Overviews and AI Mode |
| The direction of the impression trend over time | Whether the AI answer reduces classic clicks |
| The AI share within total search impressions | How much competing sites appear in the same answers |
The left column is a visibility table; the right column is a performance table. Today, the report only fills in the first. Most teams that open the screen without making this distinction end up with either a false sense of success or a false alarm.
A Step-by-Step Reading Order
- First, note total Web impressions in the main report. Read AI impressions not as an independent number but as a share of this total.
- Drill down into the page breakdown. The list of pages receiving impressions usually turns out narrower than expected, and it shows which type of content gets chosen as a source.
- Open the classic performance of the same pages separately in the main report. Pages with high AI impressions but low classic clicks form a separate group, and that group is the priority for content work.
- Interpret the country and device breakdowns only if there's sufficient volume. The thousand-row data limit and low-volume days can easily make these two breakdowns misleading.
- If the chart total and the table total don't match, don't treat it as an error. Google attributes the difference to the methodological difference between property-level aggregation and page-level aggregation.
- Check the AI control in the settings. If the site has been excluded from these surfaces, the report stays empty; that isn't a visibility problem but the result of a choice.
The Report's Blind Spots
- There's no query data. You can't see which question produced which impression.
- AI Overviews and AI Mode aren't shown separately; the two are combined into a single total.
- Search Labs experiments are out of scope, so surfaces in the testing phase don't enter the data.
- There's no search type defined for AI in the Search Console API. Accepted values are limited to web, image, video, news, discover and googleNews, so the report doesn't flow into automated dashboards and exports are done manually.
- The thousand-row limit and time constraints of the main performance report apply here as well.
- Because the report is new, its historical data is short. Long-term comparison isn't possible for now.
- The most recent days are marked as preliminary data and may change in the following hours. Decisions shouldn't be based on the last day's figure.
These blind spots don't make the report worthless; they narrow its use. The screen is a visibility meter, not a traffic meter. A rising impression share shows that your content is being selected as a source on these surfaces, which is a stage that comes before the click. A share that stays low usually means the content isn't structured to be cited; the work behind how to appear in AI Overviews is what actually moves the number on this screen.
Frequently Asked Questions
Are AI impressions added on top of total impressions?
No. Google states that this report contains data belonging to the Web search type in the main performance report. Because AI impressions are a slice carved out of the total, the two numbers aren't added together but expressed as a ratio of one another.
Can AI Overviews and AI Mode be viewed separately?
No. The report combines the two surfaces into a single impression total. On this screen, you can't tell whether a page's impressions came from the AI Overview box or from the conversational interface.
What should you do if the report looks empty?
First, check the AI control in the settings. If the site has been excluded from these surfaces, there will be neither impressions nor traffic, and the change can take a few days to settle. If the control is on, an empty screen means the site hasn't yet been selected as a source on these surfaces.
Can AI traffic be separated out in Analytics?
It can't be separated outside Search Console either. Visits from these surfaces reach the site as Google organic traffic and carry no marker that would distinguish them from a classic result click. Separations built on the referrer therefore don't work reliably.
Is this report enough to measure the success of AI visibility work?
Not on its own. The report covers only two of Google's surfaces; visibility on ChatGPT, Gemini and Perplexity doesn't appear on this screen at all. And since there's no click or query breakdown, you can't tell from here whether visibility is turning into business results. When measuring generative engine optimization work, treat this screen as just one of several sources.